Less people are slinging metaphorical feces at one another on FinTwit and Crypto Twitter.
Panic from the banking crisis in March has subsided.
The weather is getting nicer in the Global North, and people here hate themselves a little bit less now that they can feel the sun on their skin again.
So, are we back in the early-to-mid stages of a new bull market?
Let’s take a look at some charts (all sourced from TradingView) to see what they might be telling us.
Starting with the big mama, the DIA 0.00%↑ — or the SPDR Dow Jones Industrial Average ETF Trust, which tracks the Dow Jones Industrial Average (DJIA) — it’s been in a downtrend since the beginning of 2022.
It looks like it wants to break out but hasn’t done so yet.
Moving over to the SPY 0.00%↑ — or the SPDR S&P 500 ETF Trust, which tracks the S&P 500 — the downward trend broke about two months back, which is some indication that we are back in an equity bull market.
The QQQ 0.00%↑ — or the ETF trust that tracks the Nasdaq 100 — also broke out of its downtrend about 2 months back.
The price of gold came close to an all-time high in US dollar (USD) terms this past week.
It’s been in an uptrend since November 2021, and just the fact that The Fed has essentially promised to backstop deposits in all banks makes me believe that GLD 0.00%↑ — or the SPDR Gold Trust, which tracks the price of gold — will continue to rise for at least the next couple months (not financial advice).
Actually, the fact that central banks are buying gold at record rates and that some politicians are talking about going back to the gold standard is also probably contributing to the rise in the price of gold.
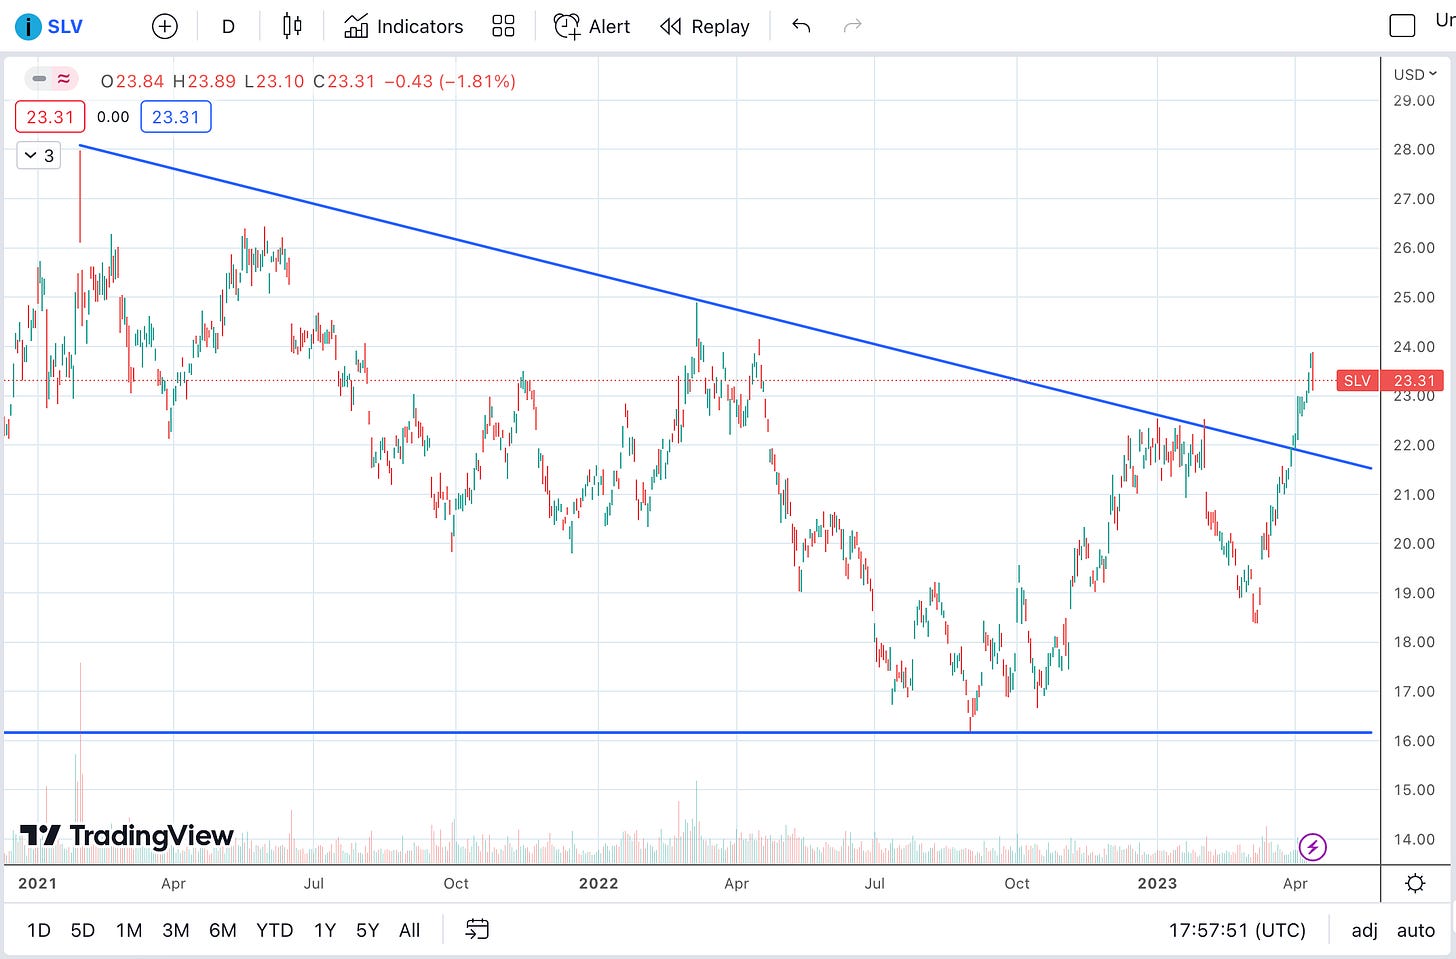
SLV 0.00%↑ — or the iShares Silver Trust, which tracks the price of silver — has broken out of a downtrend that started back in early 2021.
If it comes back down to $21.50 and holds it as support, you may have a good entry point (not financial advice).
Bitcoin ($BTC) broke out of the channel it had been in for almost a year this week.
If it can hold about $30k as support, it will probably climb higher (not financial advice).
I’d be very surprised to see it climb above about $48k before the next halving, though.
What’s this “next halving” you speak of, Frank?
Good question.
To learn more about what a Bitcoin halving is and how halvings have historically impacted the price of $BTC, check out the following article I wrote: “Is it time to sell your Bitcoin? (MediaFeed)
Ether ($ETH) — the native asset of the Ethereum blockchain — had a big week this week.
It’s back about $2k for the first time in about a year.
If it can hold $2k as support, I think we could see it climb to somewhere between $3,000 and $3,600 in the next few months.
Personally, I’d sell as it approached those levels (not financial advice).
The chart below is the $ETH/$BTC chart — which continues to fascinate me.
Looking at this chart through a certain lens, you could say that the price of $ETH has been in a downtrend vs. the price of $BTC since late 2017.
(You could also say it broke out of that downtrend in 2020 and has been trading in a channel vs. $BTC since 2021.)
I find it super interesting that $ETH continues to struggle to break that top blue line (the one that indicates that $ETH has been in a downtrend vs. $BTC for about five years).
Binance Coin ($BNB), which I’m using as a proxy for alts, seems to have broken out of the channel it’s (mostly) been in since last June. However, keep in mind it’s peeked above the top channel line twice since June 2022 and didn’t hold the line as support either time.
If it does hold the line as support, this may be an indicator that alt season is upon us.
I thought post-banking collapse crypto rally would revolve primarily around $BTC, as it’s the only crypto asset that actually offers a truly decentralized alternative to banks.
Yet, we saw $ETH rally hard against $BTC this week, and now we’re seeing alts start to do their thing. I guess degens gonna degen, and the dynamic in the following chart may just keep playing out over and over again.
Personally, I think trying to capitalize on/trade the dynamic highlighted in the chart above is dangerous, and I only share it to indicate that this dynamic may be at play.
And to close out this edition of the newsletter, here’s a chart for RIOT 0.00%↑ — the stock for Riot Blockchain, Inc., a bitcoin mining company.
It just broke out of a eight month-long channel. If it comes back down to about $10.50-$11 and holds that level as support, it’s likely a good buy (not financial advice), especially considering that the all-time high for this stock is almost $80.
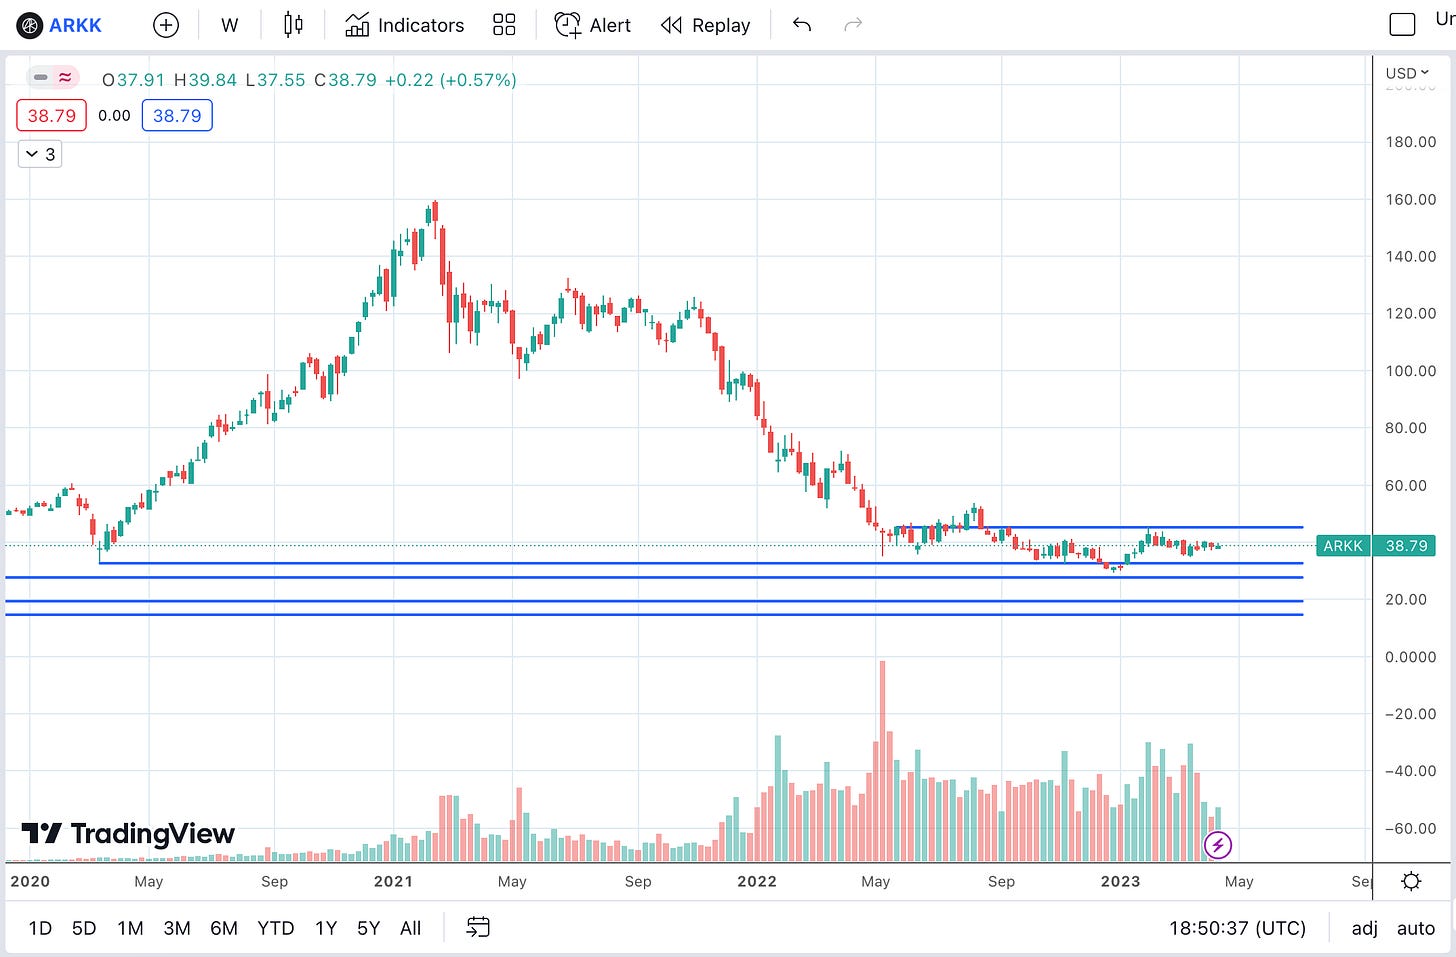
Bonus chart: ARKK 0.00%↑ — the ARK Innovation ETF
You may be thinking “Frank, why are you showing us charts of assets that have already broken out of either their downward trends or long-term channels? Let me know about that hot stock/asset that’s about to pop off SO I CAN GET RICH AND RETIRE FOREVER.”
To this, I say, “My friend, you’ve mistaken me for a financial advisor, which I’m not. I’m just a dude who discusses market trends in a newsletter because I find it super interesting. You should always do your own research and make your own decisions when investing.”
Back to ARKK — I find it interesting that the price of this asset has remained suppressed. I like what the ETF holds, and I personally think it’s undervalued right now (not financial advice).
I guess we’ll see if ARKK joins its risk-on asset brethren in this uptrend we’re seeing soon. Worth keeping an eye on IMO.
And that, my friends and readers, is all.
Happy Sunday! Happy new week! Happy spring! Happy life!
Best,
Frank


